If you’re new to trading and want to learn more about technical analysis, a candlestick is among the first terms you’ll come across.
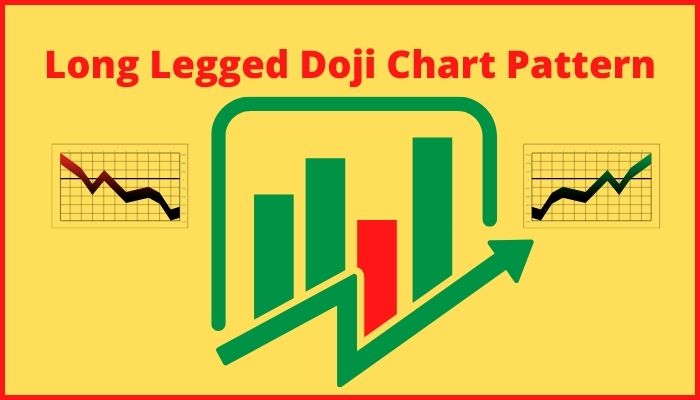
A candlestick chart is a type of chart that displays the open and close prices of a share, as well as the high and low for a specific time range. While one famous candle among the most famous candles is Long Legged Doji.
Let’s discuss the candlestick chart, what is Doji and Long Legged Doji in detail with examples.
Table of Contents
What is Candlestick ?
Candlesticks, a Japanese tool used by traders to monitor rice prices, became a common technical analysis tool all over the globe. A candlestick chart usually represents the price change for a specific period.
Characterizes a candlestick chart
- The structure and shadows of a candlestick chart classify it.
- The actual body is the widest portion of the chart, and it represents the price variance between the start and end of the business day.
- The shadows are the protruding thin lines that reflect the day ‘s higher and lower values.
- The wick is the higher shadow or line, while the tail is the bottom shadow or line.
What is Doji?
A doji—or, more precisely, “dōji”—is a term for a trading session in which the open and close of a stock’s candlestick are almost equal, and are frequently used in patterns. In Japanese, the phrase doji represents “mistake” or “anomaly,” but in trading, it refers to a one-of-a-kind event in which a stock’s open and close values are the same. Doji candlesticks have the shape of a cross, an inverted cross, or a plus sign.
Types of Doji
- Standard doji
- Long legged doji
- Dragonfly doji
- Gravestone doji
- Price doji.
What Is the Long Legged Doji?
The long legged doji is among the several types of candlestick patterns usable. The long-legged doji is a candlestick with lengthy upper and lower shadows and a tiny genuine body because the opening and closing prices are nearly equivalent. This is a sign of market uncertainty as neither bears nor bulls are in command.
Important Points
- The pattern indicates uncertainty and is particularly noticeable after a large rise or fall.
- Although some traders may be interested in trading the one-candle pattern, others prefer to wait and see what happens following the long-legged doji.
- The pattern isn’t necessarily noteworthy, and it doesn’t always indicate the conclusion of a trend—it could signal the beginning of a consolidation phase, or it could simply be a tiny setback in the present trend.
Explanation of Long Legged Doji
A long-legged doji suggests uncertainty regarding the price of the underlying security’s upcoming trend. Long-legged dojis can also signal the beginnings of a consolidation phase, in which the price creates one or more long-legged dojis before tightening or breaking out to begin a new direction.
When long-legged doji candles appear during a major advance or decline, they are considered the most noteworthy. The long-legged doji indicates that supply and demand factors are approaching balance and that a trend reversal is possible.
This is due to the fact that balance or uncertainty shows that the price is no longer moving in the same direction. It’s possible that general sentiment is shifting.
Example of Long Legged Doji
The chart of Hero Moto Corp below highlights a few examples of long-legged dojis. The examples demonstrate that the pattern isn’t always meaningful in and of itself. However, the larger framework, or market structure, is important.

How to Trade Long Legged Doji ?
Since trading focused on the pattern is not essential, there are several strategies to trade a long-legged doji. The pattern is only one candle, which some traders believe is insufficient to make a trade decision, particularly given the price did not move significantly on a closure level.
Before moving, some traders will want to see further confirmation—price fluctuations that follow the long-legged doji. This is due to the fact that long-legged dojis might appear in groups or as part of a bigger consolidation.
Based on which manner the price breaks out of the consolidation, it may lead in reversals or continuations of the previous trend.
Ideas For Traders Regarding long leg doji
If you are willing to trade is pattern, Here are some good ideas for you:

-
Entry Point
Since the pattern is seen as an uncertain time, a trader could watch for the pricing to rise over the long legged doji lower or higher. Initiate a long trade if the price climbs higher. Initiate a short position if the price falls under the pattern.
Secondly, wait for a consolidation to develop across the long legged doji before going shorter or longer when the price rises higher or lower to the consolidation.
-
Risk Management
Put a stop loss under the pattern or consolidation if you’re going long as the price climbs over the long legged doji or consolidation.
Similarly, Put a stop loss over the pattern or consolidation if going short as the value drops under the long-legged doji or consolidation.
-
Market framework
If the long legged doji comes around a key support or resistance level, it is more likely to deliver a reliable alert. For instance, if the price is increasing and then develops a long legged doji around a significant resistance level, the possibilities of the price declining if it falls under the long legged doji bottom are increased.
-
Profit Booking
Long legged dojis don’t have profit criteria associated with them, so traders will have to figure out a means to cash in if any profit opportunities arise. Technical indicators might be used, or traders might leave when the price passes a moving average, for instance. A set risk/reward ratio may be used by certain traders. For example, if they spend Rs. 2000 on a transaction, they will leave when they are up Rs. 3000 or Rs. 4000.
Conclusion
Similar to other chart patterns, a trader must use his mind while Initiating a trader using long legged doji. There are some great possibilities of profit if traders follow this pattern with your experience. However, traders must remain conscious regarding the risks.
This is all from our side regarding the long legged doji meaning. Let us know your views in the comment section.
Other Interesting blogs related to long legged doji candlestick
Three Outside Down Bearish Pattern
How much one can earn in day trading in India?
How to choose stocks for intraday trading?
FAQ About long legged doji candlestick
long legged doji bullish or bearish?
If long legged doji formed after an uptrend it will be bearish and if it developed after downtrend that it will be bullish.
Types of doji?
There are 5 types of Doji - Standard, Long Legged, Dragonfly, gravestone and price doji.
long legged doji at resistance?
It means that prices can fall down to lower levels.
long-legged doji at bottom?
It means that prices can go up in the next few seasons.
Long legged doji scanner?
There are many software available in the market for the same. However, it is better to find it manually as it's not 100% reliable.